NWS Alerts, Maps, and Webhooks
Sometimes you get an interesting idea after watching hours upon hours of tornado coverage, an itch to get your very own feed of watch and warning information from the National Weather Service and their awesome API.
From there, you’re like: “Self, it would be even more awesome if there was like a map or something showing where the watch/warning was actually at!”
This is where I realized that I might’ve made a mistake because I was about to learn a lot about maps and even more painfully: projections.
The Idea
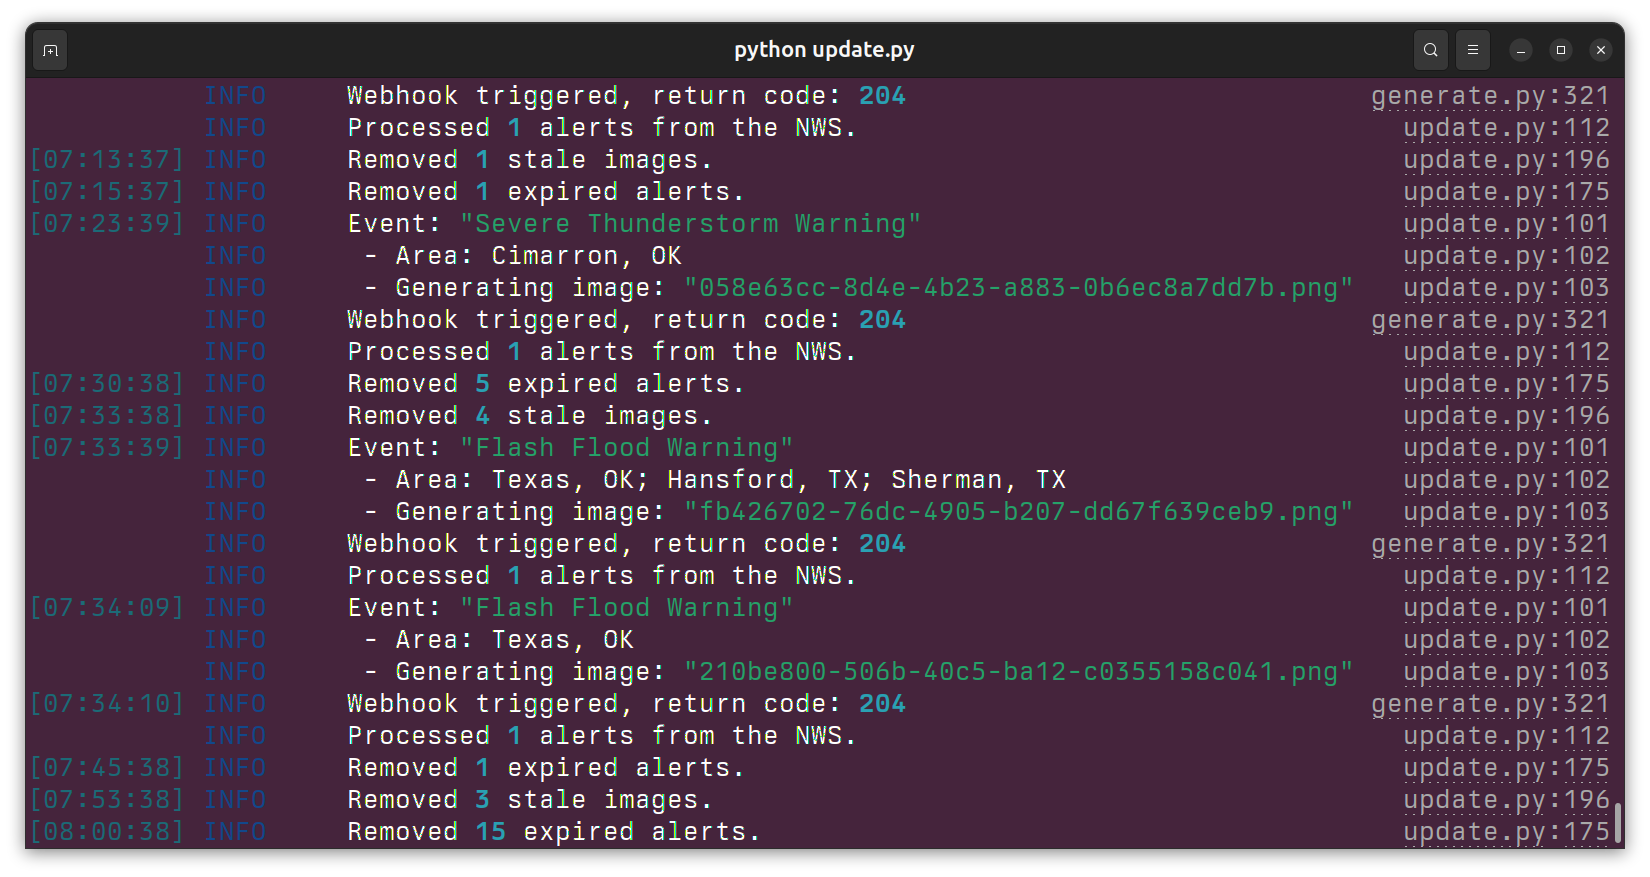
So, the very basic idea was to scrape the NWS API every 10 seconds or so, only grab the extreme and severe events because I don’t want to be that guy, and then plug them into a NoSQL database. From there I can compare the next pull with what’s already in the database and use that to signify what has changed.
It’s a good start, and probably the easiest thing to do so far. A quick Docker Compose file running MongoDB and we’re already in a good place.
Grabbed the requests module for Python, set up everything to run via a combination of the schedule and threading libraries. Pretty straight-forward, and gets the job done.
Could Be Better…
Okay, yes, I’ve got the data, but I need more.
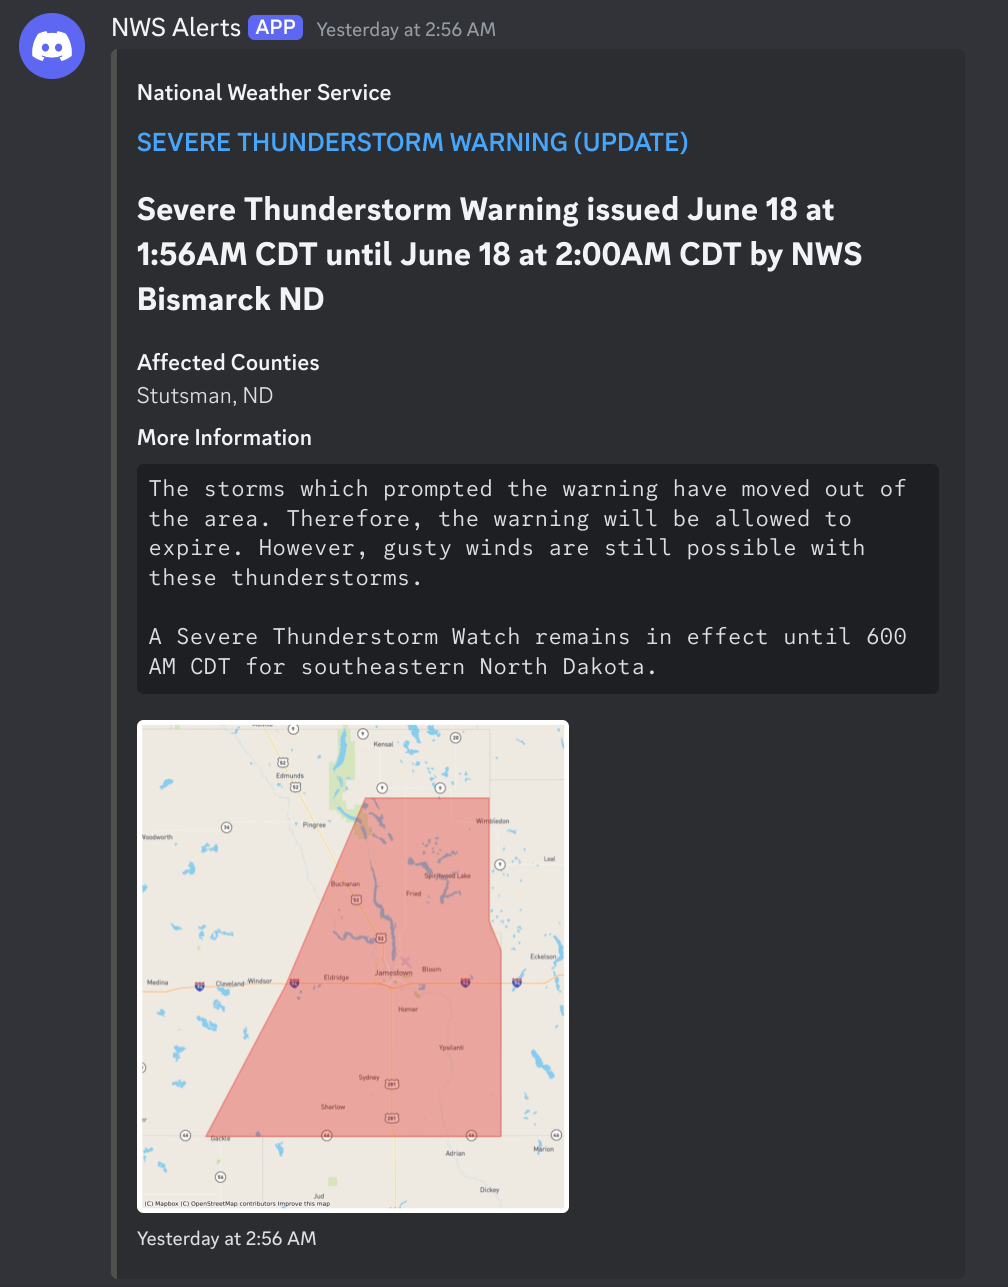
I could just spam a Discord channel via webhook embeds with the text of the warning, but that doesn’t seem like the best of ideas. It’s not aesthetic and reading is just so boring all on its own. However, all I need to do is take the polygon information from the events, overlay it on a map, use something like MapBox to give me the map information on the bottom layers, and I’m done.
So, my first attempt at making my own maps used plotly and geopandas. The maps looked good, but the biggest issue was keeping the polygon inside of the map bounding box. If the warning area was tall and skinny, then the polygon wouldn’t be completely displayed on the screen. This was a pretty major issue, and I spent a lot of time trying to get it to do what I wanted.
It refused.
Secondly, there’s another issue I haven’t mentioned: warnings are polygons contained in the weather alert. A series of lat/longs that are easy to grab, easy to plot, and easy to display.
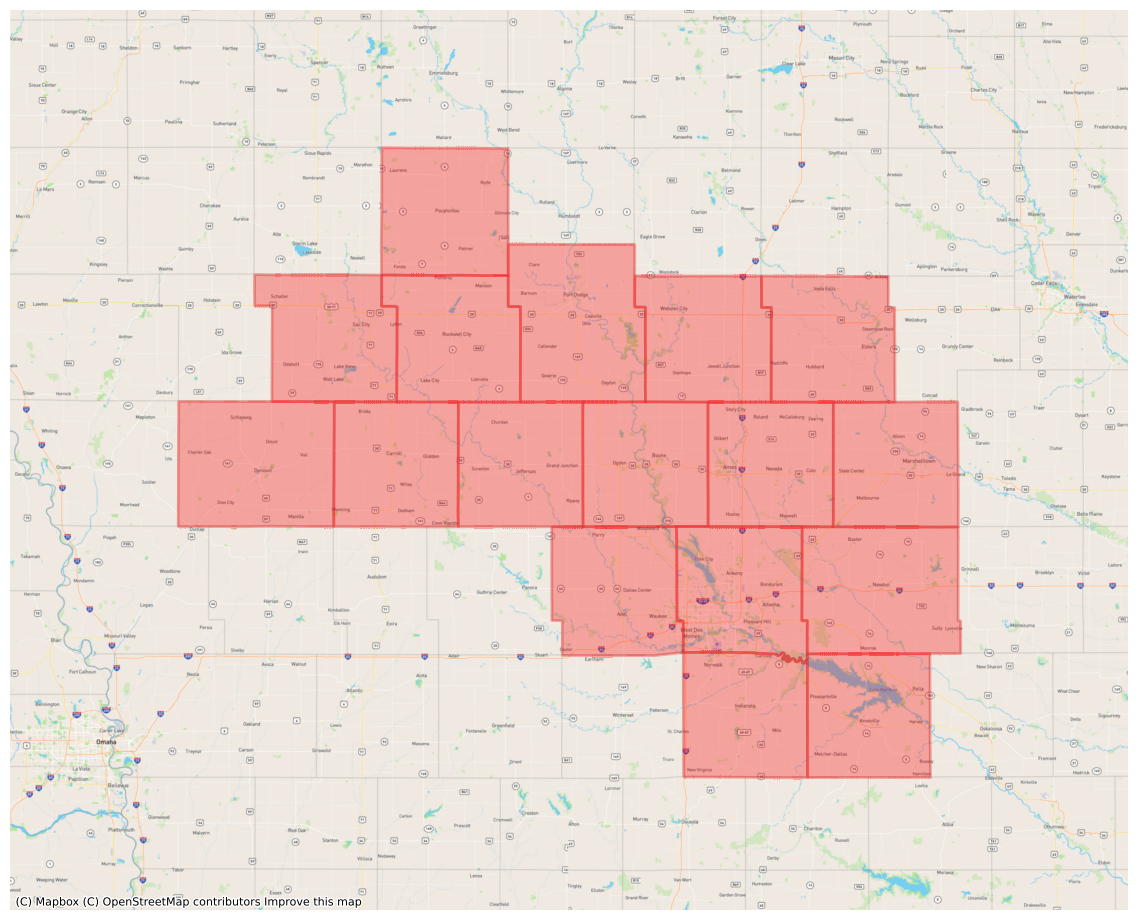
Watches are an entirely different thing. You get a list of county codes. It’s your job to find out how to display those bastards on a map. Thankfully, the NWS does have that information which the populate_data.sh script grabs.
Using Matplotlib
Plotly wasn’t working, so it was time to remove it and replace it with pyplot from matplotlib along with contextily (for the maps), geopandas (for working with polygons), cartopy (projections and more polygon stuff).
After a ton of reading, coding, more reading, frustration, and coding I finally got the maps working. All of the polygons (counties and warnings) were now inside of the generated image, and the images were fairly small all things considered.
Discord Webhooks
Alright, I now have all of the event information. I have a cool map of the alert. Now I need to put it all together via webhook embeds to spam that Discord channel.
Time to bring in a bit of jinja2 to template out the webhook payload. This is also pretty easy to do as there is tons of documentation on how that should look. However, just a small thing that I didn’t know: there are limitations. Fields in a Discord embed cannot have more than 1,024 characters which means I had to trim down the alert information box or the webhook would fail.
After some futzing around with that, I only really needed one more thing: to serve the images.
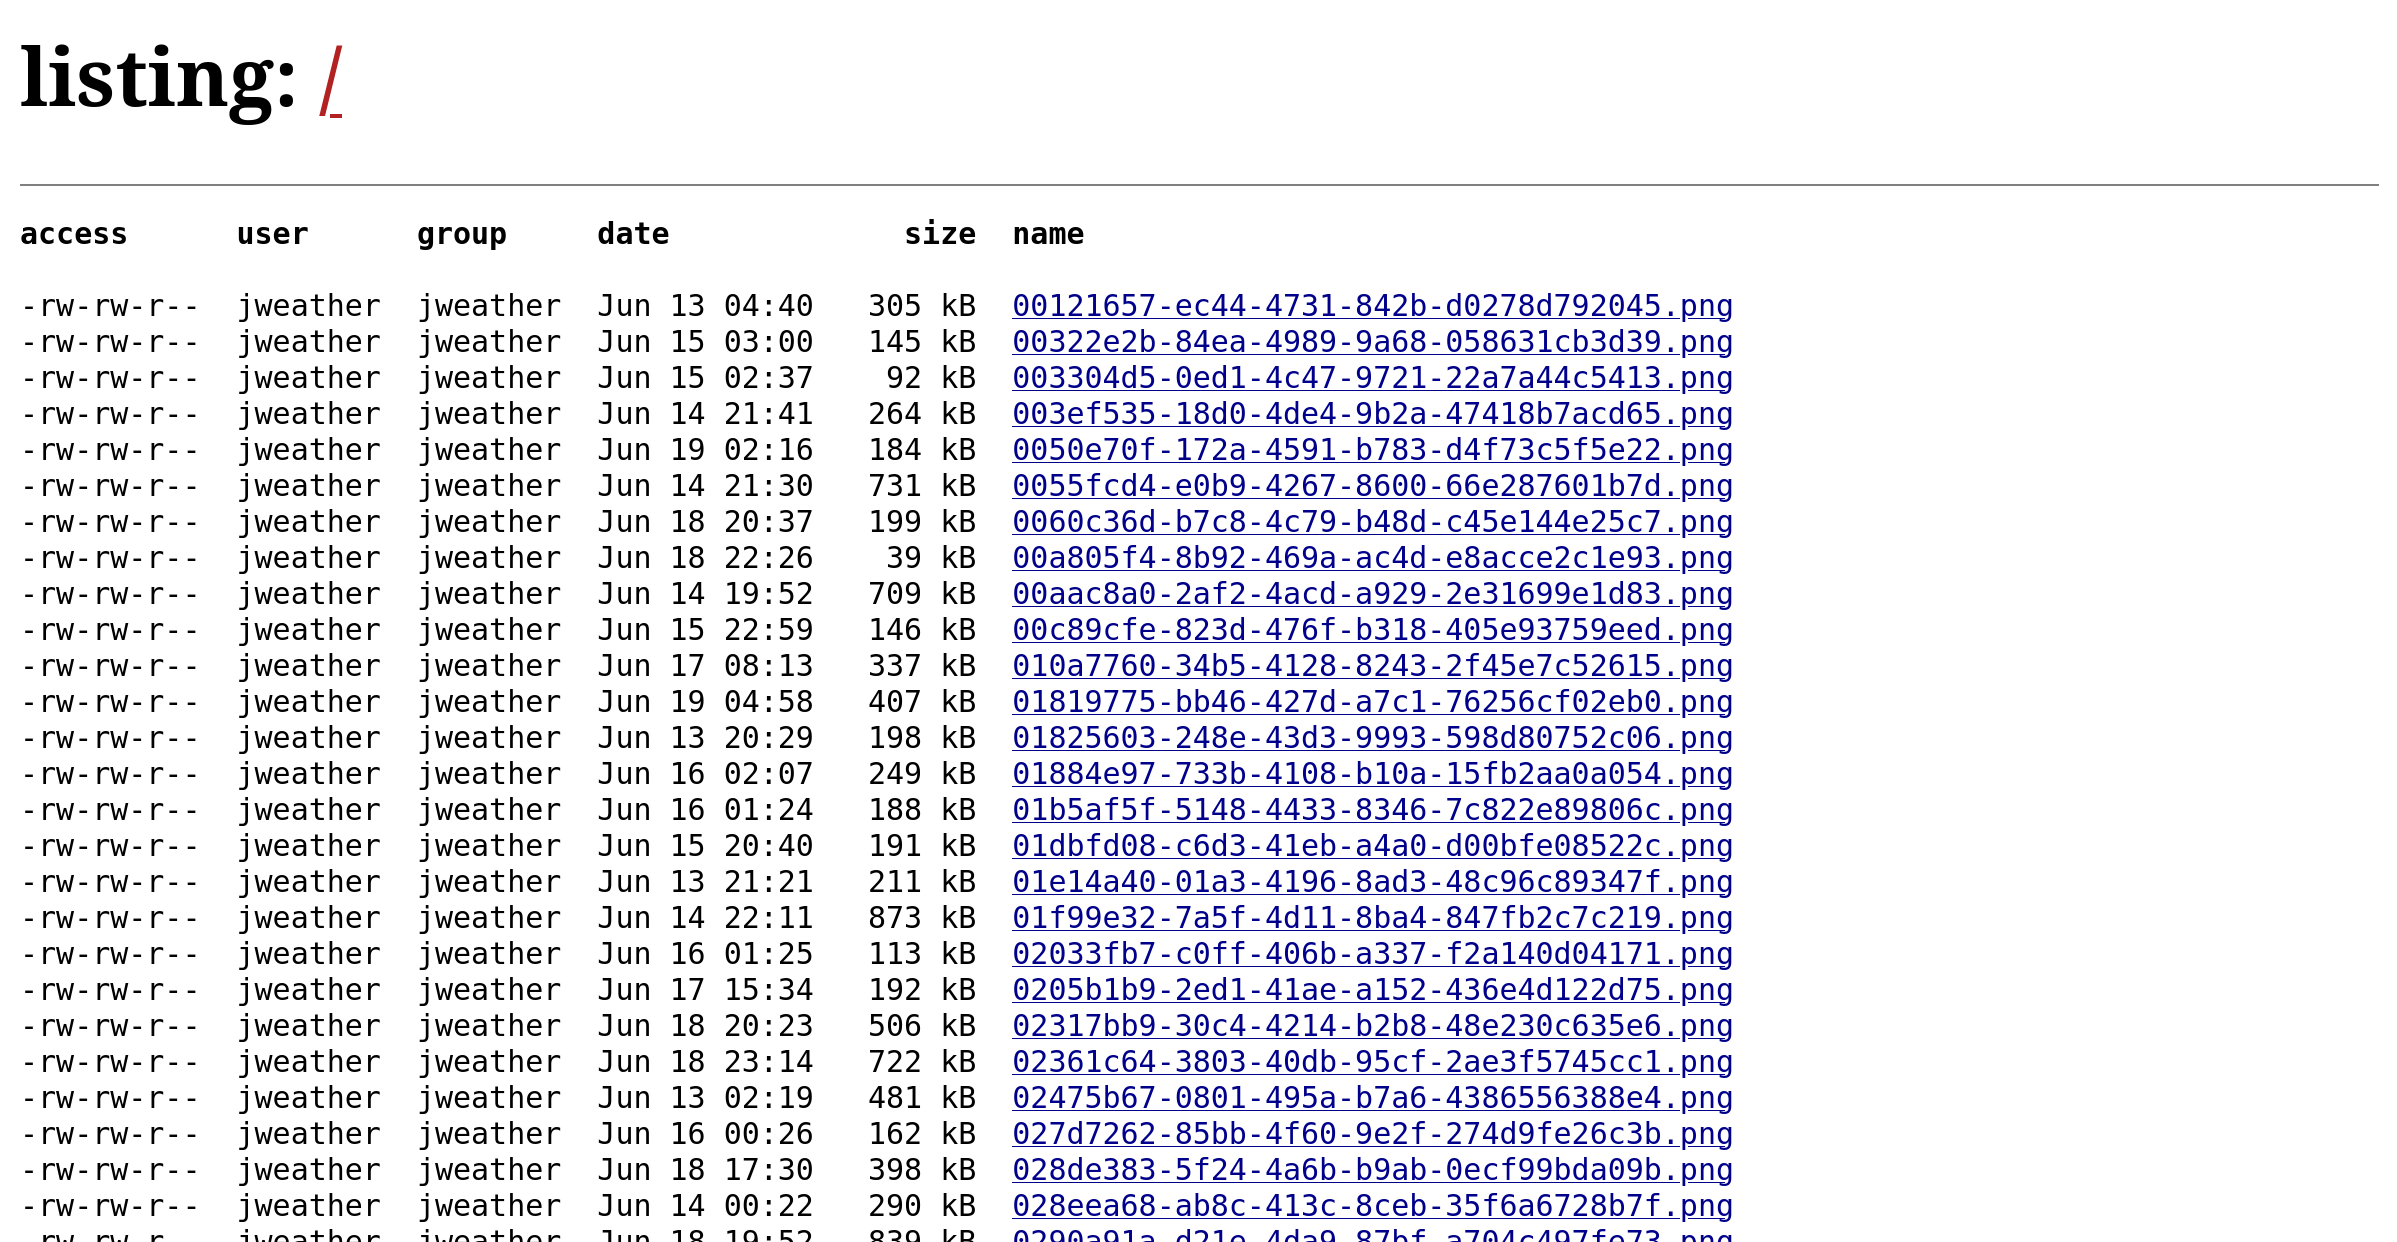
All of the IMAGES
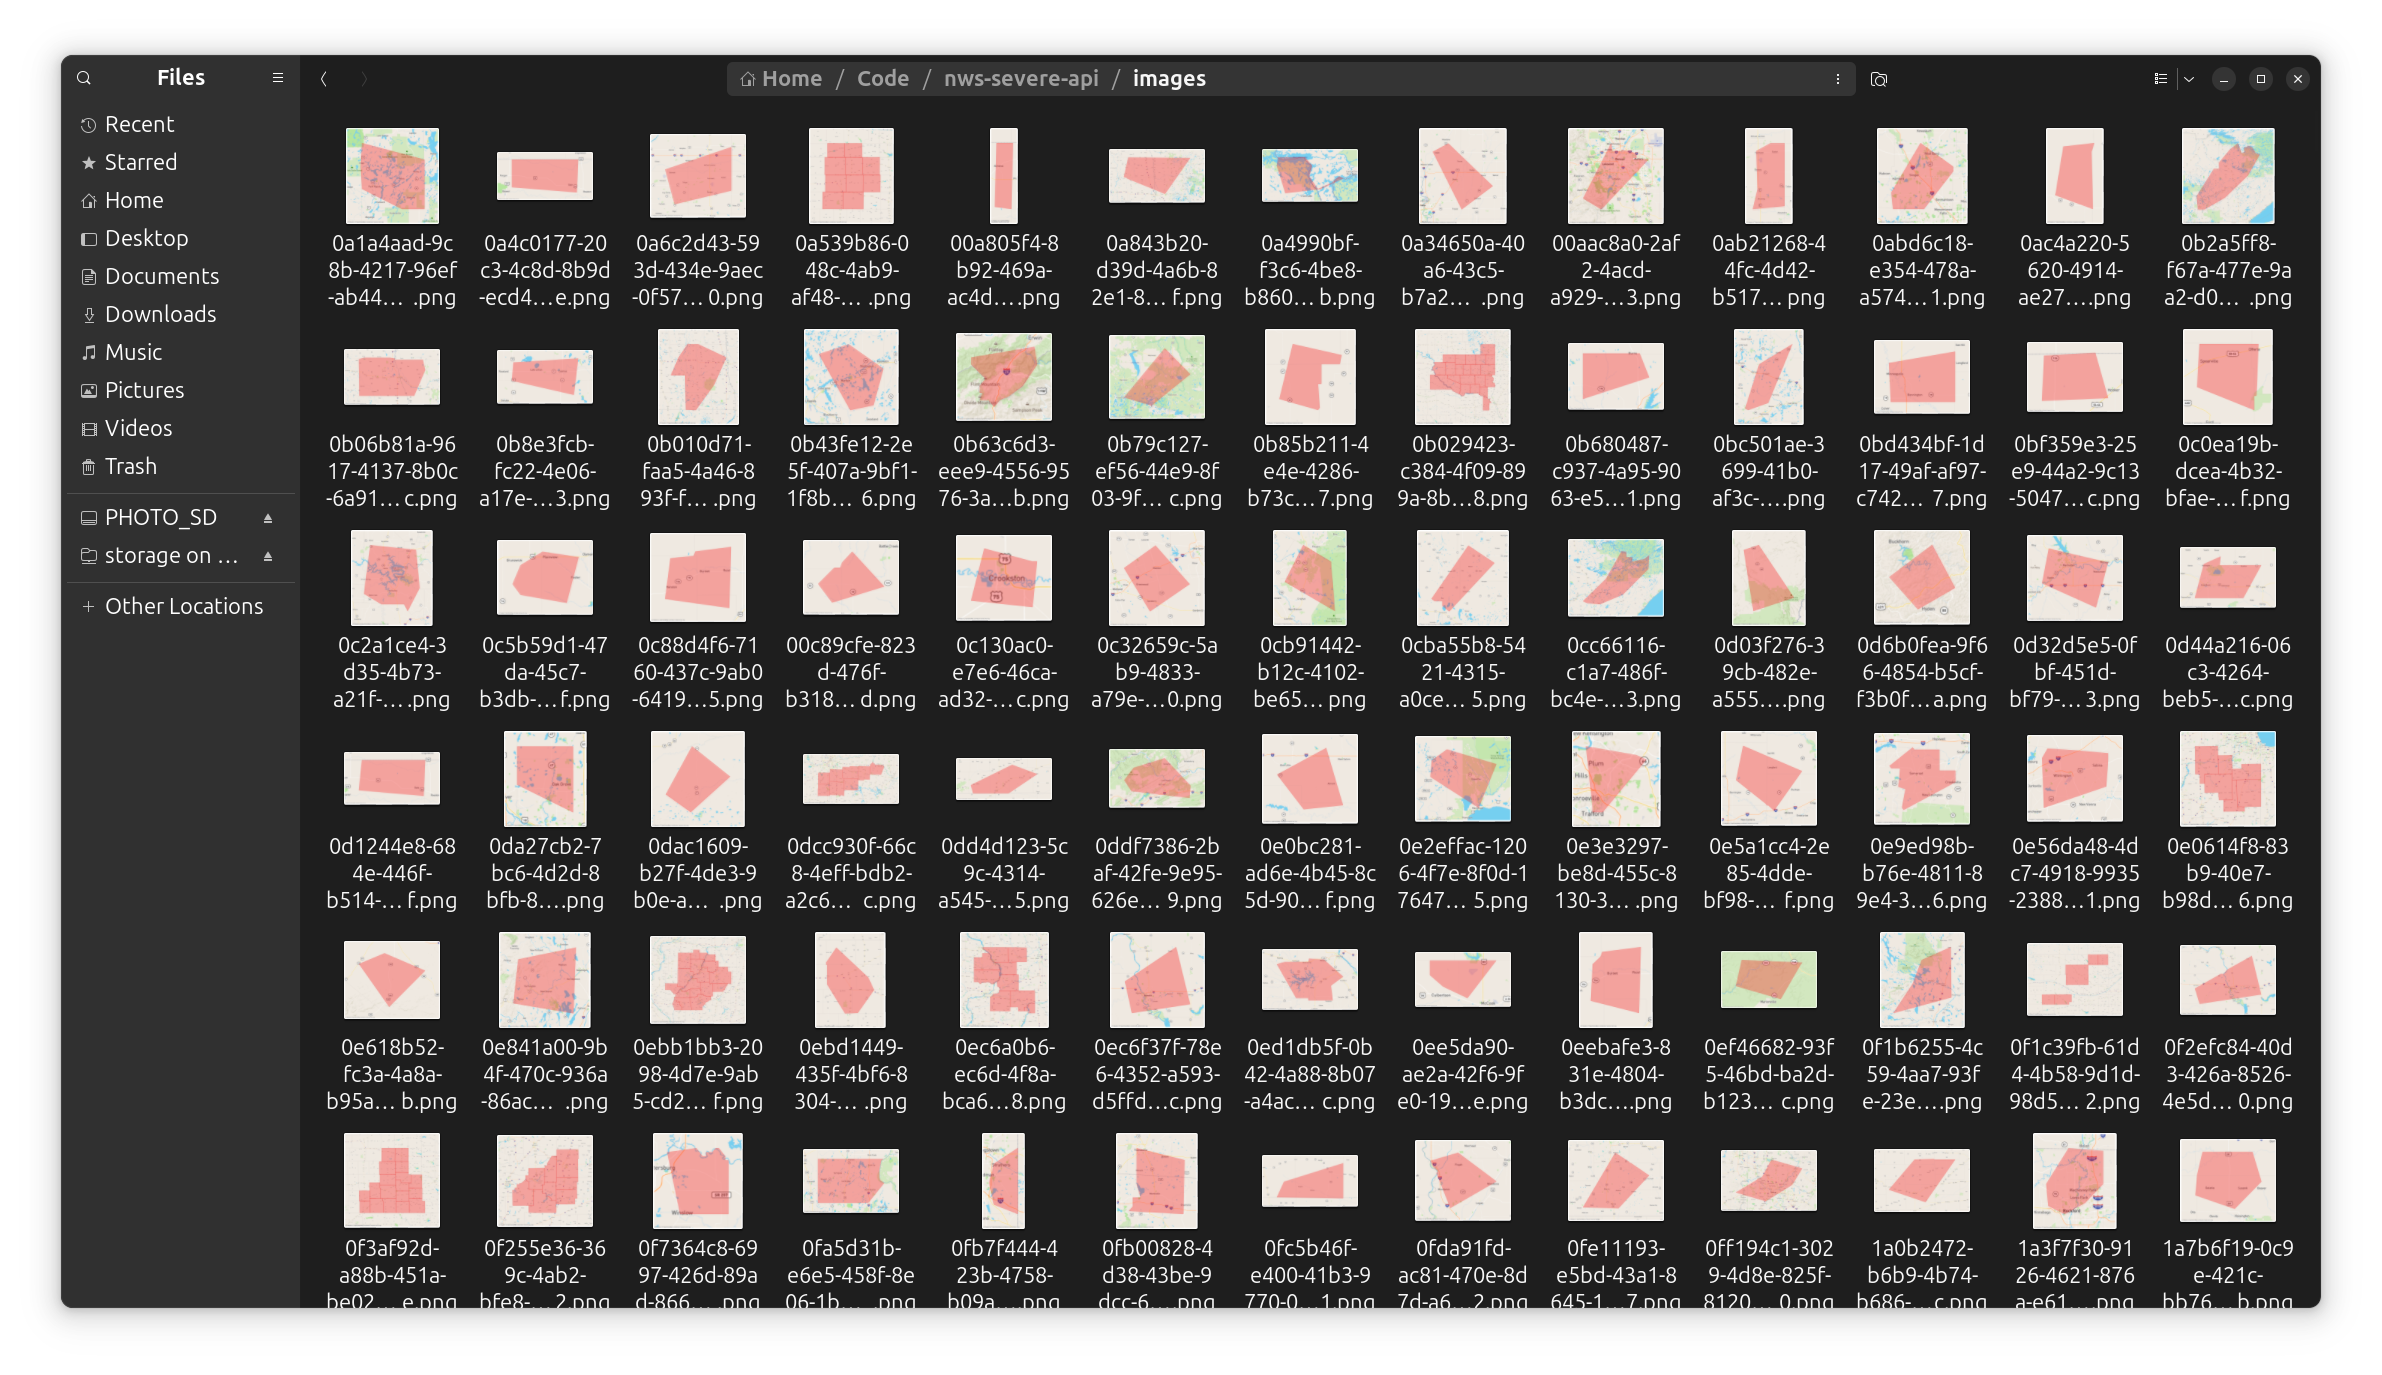
There are a ton of these things, and since this is going into a webhook, they need to be accessible over the internet publically. Not too difficult, but does take a smidge of planning. You could go with just serving them using your IP address and poking a hole in your router and it would probably work.
Fortunately, I do have DNS setup to point to my static IP address at the house, and nginx sitting between the greater internet and the stuff I serve which meant it was only one configuration file away from pointing to my files.
I’m using webfs currently to serve the files which is pretty simple, and wrote a small shell script to serve those images out. You could also use Python or basically anything to serve them depending on the amount of traffic you’re expecting.
Conclusion
It was an interesting project, and I’m surprised it works as well as it does. I think I’m gonna just let this one run for a bit before trying to do more stuff with it. The source code is available in GitHub, so have fun if you want to take a gander!